Organizing Strategies
GRAPHIC ORGANIZERS help facilitate instruction.
Purpose: To provide an interactive visual structure that engages the learner and promotes retention of knowledge and the ability to transfer that knowledge into written evidence of processing and expression of what is learned.
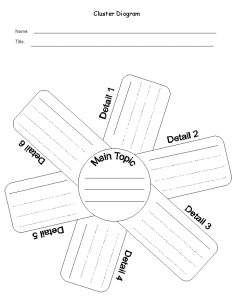 Graphic Organizers are important Non Verbal Representation tools that use visual symbols to express and sort ideas and concepts to convey meaning. Graphic Organizers can be simple or advanced and help the learner to make connections and see relationships between facts, terms, and or ideas within a learning task. Graphic Organizers are often referred to as a “map” because it can help teachers and students “map out” their ideas in a visual manner. There are many similar names for graphic organizers including: knowledge maps, concept maps, story maps, cognitive organizers, concept diagrams or advanced organizers. While sometimes mistakenly called advance organizers which are organizers that can be used in advance of a lesson, advanced graphic organizers have a higher degree of complexity.
In 1992, Jay McTighe in his book Graphic Organizers: Collaborative Links to Better Thinking outlined three main ways teachers may use graphic organizers in their teaching and a number of ways that students can use them to aid in the learning process.
-
Before instruction, teachers may use a graphic organizer to attempt to provide structure for the presentation of new material while indicating relations between ideas. Teachers can elicit information from students by creating a graphic organizer on the blackboard to get an accurate idea of students’ prior knowledge
-
During instruction, graphic organizers can help students to actively isolate, process and reorganize key information. This is because graphic organizers allow students to approach subjects cognitively because they assist thinking. The student must take an active role in learning while processing and reorganizing information. Modifying an organized structure of information gives students an opportunity to learn from their own mistakes. It also allows students to construct maps that are appropriate to their individual learning styles.
-
After instruction, students can construct their own organizers using the full text to isolate and organize key concepts. This summarization technique is a tool to see if students can interpret what was being taught and state it in concise, accurate terms. Post-instruction graphic organizers also encourage elaboration. If a student can connect prior knowledge with what was learned and identify relationships between those ideas, they are actively learning.
When introducing students to a new graphic organizer, you should describe its purpose, model its use, and provide students with opportunities for guided practice. Once students become comfortable with using the organizer, more independent applications are appropriate. In the end, you should encourage and assist students to create their own organizers.


